执行摘要
我们的性能测试表明,Manticore Search 在分析大量 Nginx 日志数据时显著优于 Elasticsearch,Kibana 仪表板渲染速度最快可提升 3 倍。本文展示了性能差异,解释了如何运行自己的对比测试,并突出了 Manticore Search 在日志分析工作负载中的关键优势。
介绍
高效分析和可视化大量数据对许多企业至关重要。本文使用基于 Nginx 日志的相同数据集,比较了两种流行搜索引擎 Manticore Search 和 Elasticsearch 的性能。
目标是展示 Manticore Search 如何为处理和可视化大数据集提供高效解决方案。为了便于进行此比较,我们创建了 Manticore Search Kibana 演示 ,这是一个公开可用的项目。来自 db-benchmarks.com 的基准测试也突显了 Manticore Search 相比 Elasticsearch 的卓越性能。
演示项目概述
演示项目使用 Kibana 作为可视化工具,连接到 Elasticsearch 和 Manticore Search。演示数据集使用 kscarlett-generator 工具从 Nginx 日志生成。
这些可视化效果受到一篇流行博客文章 " 设置 Kibana 仪表板以分析 Nginx 日志数据 " 的启发,使搜索引擎性能的比较更加清晰。
环境设置和运行演示
要设置和运行演示:
- 确保已安装 Git 和 Docker Compose 。
- 克隆存储库并导航到项目目录。
git clone https://github.com/manticoresoftware/kibana-demo.git cd kibana-demo - Choose between using pre-built indexes for a quick start or generating new data by modifying the log-generator configuration. See the demo Github repository for details.
- Configure the environment as needed by updating the
.envfile:- Adjust the number of log entries.
- Customize the frequency of data updates.
- Set custom ports for Kibana dashboards.
- Launch the environment by running the
start.shscript. This will set up the Docker environment. - Access the Kibana dashboards:
- For Elasticsearch, by default - http://localhost:5612
- For Manticore Search, by default - http://localhost:5613
- Import pre-built Kibana visualizations using the
kibana_objects.ndjsonfile included in the demo. - Explore the dashboards to analyze the Nginx log data and compare performance between Manticore Search and Elasticsearch.
- Stop the environment after evaluation by running
docker-compose down.
This setup ensures flexibility to suit your specific requirements while keeping the process straightforward.
Performance Comparison
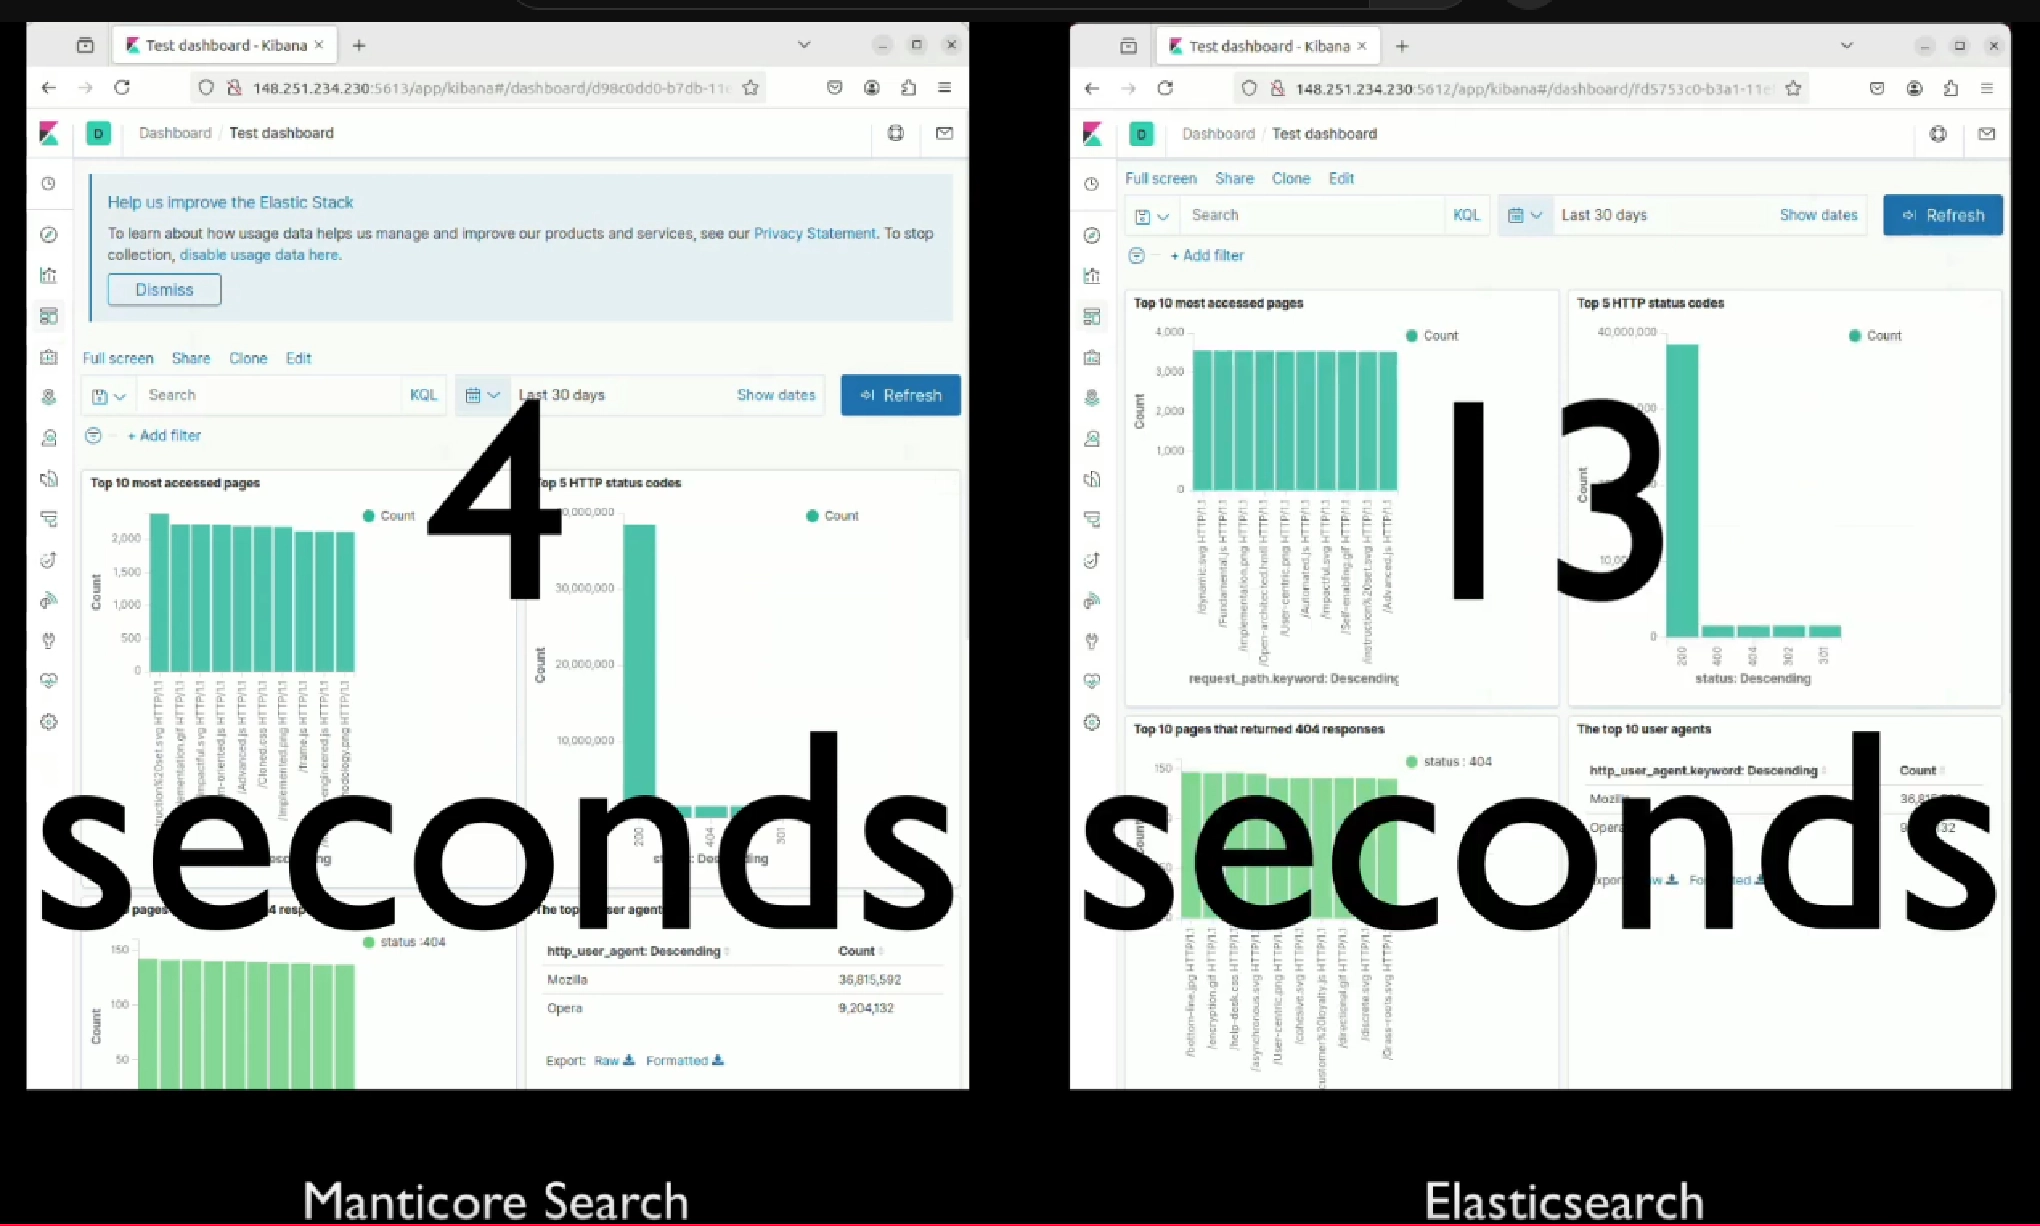
The primary focus of this test is the dashboard rendering speed in Kibana. Manticore Search consistently outperformed Elasticsearch, delivering significantly faster visualization rendering.
A video demonstration further illustrates the performance difference. Using the demo dataset of over 46 million documents and eight different Kibana visualizations combined into a dashboard, the video compares the time taken to load the dashboard with Manticore Search versus Elasticsearch.
Using Kibana with Manticore Search
Loading Data
Loading data from sources like Logstash or Filebeat into Manticore Search for Kibana processing is also straightforward. Refer to these sections in the Manticore documentation for guidance:
You can also explore examples provided in this interactive tutorial:
Limitations and Work-in-Progress Features
While there are some known limitations and work-in-progress features, such as:
- Support for newer Kibana versions (beyond 7.6)
- Handling Elasticsearch-specific data types like geo data
- Support for index management tools available in Elasticsearch like ILM
these are being actively developed to improve compatibility and functionality.
Other Advantages of Manticore Search
Besides, Manticore Search offers several distinct advantages to its users:
- High performance, optimized for fast query processing, as confirmed by independent benchmarks and the demo project.
- Full SQL support, simplifying integration with existing systems and making it easier for developers to get started.
- Real-time indexing, enabling instant data updates crucial for dynamic applications.
- Columnar storage, designed for analytical queries, making it ideal for large datasets like log files.
- Lightweight and simple setup compared to Elasticsearch, requiring fewer resources and less configuration effort.
Conclusion
Manticore Search proves to be a powerful alternative to Elasticsearch, especially in scenarios requiring fast data processing and visualization. Independent benchmarks and the demo project consistently demonstrate its superior performance, often several times faster than Elasticsearch when handling large datasets.
To see its capabilities firsthand, try the Manticore Search Kibana Demo and explore how it can enhance your data analysis workflows.