Introduction
Percolate Queries are also known as Persistent Queries, Prospective Search, document routing, search in reverse or inverse search.
The normal way of doing searches is to store documents we want to search and perform queries against them. However there are cases when we want to apply a query to an incoming new document to signal the matching. There are some scenarios where this is wanted. For example a monitoring system doesn’t just collect data, but it’s also desired to notify user on different events. That can be reaching some threshold for a metric or a certain value that appears in the monitored data. Another similar case is news aggregation. You can notify the user about any fresh news, but user might want to be notified only about certain categories or topics. Going further, they might be only interested about certain “keywords”.
Applications doing percolate queries often deal with high load: they have to process thousands of documents per second and can have hundreds of thousands of queries to test each document against.
Both Elasticsearch and Manticore Search provide Percolate Queries.
While Percolate Queries has been present in Elasticsearch for some time, in Manticore it was added in 2.6.0, still missing in Sphinx. Today I'd like to do some performance measurements to figure out the numbers each of the technologies can provide.
Test case
Many companies working in social media marketing industry are often interested in analysis of Twitter firehose or decahose, in other words they want to search through all or part of incoming messages people make on twitter.com all over the world to understand how much the audience is interested in their customers' brands, products or smth else. To make our test closer to reality we'll also use sample tweets. I've found a good archive on archive.org here https://archive.org/details/tweets-20170508080715-crawl448 which gave me some 600K random tweets:
$ wc -l ~/twitter/text
607388 /home/snikolaev/twitter/text
The documents are json decoded, but just in case you want to get an impression of what they look like (yeah, let's imagine it's still 2005 and nobody knows what a twitter message normally looks like):
$ head text
"\u8266\u968a\u304c\u5e30\u6295\u3057\u305f\u3002"
"RT @BTS_jp_official: #BTS \u65e5\u672c7th\u30b7\u30f3\u30b0\u30eb\u300c\u8840\u3001\u6c57\u3001\u6d99 -Japanese ver.-\u300dMV\n\u21d2 https:\/\/t.co\/jQGltkBQhj \niTunes\uff1a https:\/\/t.co\/2OGIYrrkaE\n#\u9632\u5f3e\u5c11\u5e74\u56e3 #\u8840\u6c57\u6d99"
"RT @79rofylno: \uc6b0'3'\nhttps:\/\/t.co\/4nrRh4l8IG\n\n#\uc7ac\uc708 #jaewin https:\/\/t.co\/ZdLk5BiHDn"
"Done with taxation supporting doc but still so mannnyyy work tak siap lagi \ud83d\ude2d"
"RT @RenfuuP: \ud64d\uc900\ud45c \uc9c0\uc9c0\uc728 20%\uc778 \uac1d\uad00\uc801 \uc774\uc720 https:\/\/t.co\/rLC9JCZ9XO"
"RT @iniemailku83: Tidak butuh lelaki yg kuat. Tp butuh lelaki yg bisa membuat celana dalam basah. Haaa"
"5\/10 02\u6642\u66f4\u65b0\uff01BUMP OF CHICKEN(\u30d0\u30f3\u30d7)\u306e\u30c1\u30b1\u30c3\u30c8\u304c27\u679a\u30ea\u30af\u30a8\u30b9\u30c8\u4e2d\u3002\u4eca\u3059\u3050\u30c1\u30a7\u30c3\u30af https:\/\/t.co\/acFozBWrcm #BUMPOFCHICKEN #BUMP #\u30d0\u30f3\u30d7"
"---https:\/\/t.co\/DLwBKzniz6"
"RT @KamalaHarris: Our kids deserve the truth. Their generation deserves access to clean air and clean water.\nhttps:\/\/t.co\/FgVHIx4FzY"
"#105 UNIVERSITY East Concourse Up Escalator is now Out of Service"
So these will be the documents we will test. The second thing we badly need is actually percolate queries. I've decided to generate 100K random queries from top 1000 most popoular words from the tweets making each of the queries having 2 AND keywords and 2 NOT keywords. Here's what I've got (the query syntax is a little bit different between Manticore Search and Elasticsearch so I had to build 2 sets of similar queries):
$ head queries_100K_ms.txt queries_100K_es.txt
== queries_100K_ms.txt ==
ll 0553 -pop -crying
nuevo against -watch -has
strong trop -around -would
most mad -cosas -guess
heart estamos -is -esc2017
money tel -didn -suis
omg then -tel -get
eviniz yates -wait -mtvinstaglcabello
9 sa -ao -album
tout re -oi -trop

== queries_100K_es.txt ==
ll AND 0553 -pop -crying
nuevo AND against -watch -has
strong AND trop -around -would
most AND mad -cosas -guess
heart AND estamos -is -esc2017
money AND tel -didn -suis
omg AND then -tel -get
eviniz AND yates -wait -mtvinstaglcabello
9 AND sa -ao -album
tout AND re -oi -trop
The queries are meaningless, but for the sake of performance testing they make sense.
Inserting the queries
The next step is to insert the queries to Manticore Search and Elaticsearch. This can be easily done like this:
Manticore Search
$ IFS=$'\n'; time for n in `cat queries_100K_ms.txt`; do mysql -P9314 -h0 -e "insert into pq values('$n');"; done;
real 6m37.202s
user 0m20.512s
sys 1m38.764s
Elasticsearch
$ IFS=$'\n'; id=0; time for n in `cat queries_100K_es.txt`; do echo $n; curl -s -XPUT http://localhost:9200/pq/docs/$id?refresh -H 'Content-Type: application/json' -d "{\"query\": {\"query_string\": {\"query\": \"$n\" }}}" > /dev/null; id=$((id+1)); done;
...

mayo AND yourself -ils -tan
told AND should -man -go
well AND week -won -perfect

real 112m58.019s
user 11m4.168s
sys 6m45.024s
Surprisingly inserting 600K queries into Elasticsearch took 17 times longer than to Manticore Search.
Let's see what the search performance is. To not mistake with a conclusion let's first agree on few assumptions:
- configs of both Manticore Search and Elasticsearch are used just as they come out of the box or as per basic documentation, i.e. there's no optimizations have been made in either of the configs
- but since Elasticsearch is multi-threaded by default and Manticore Search is not I've added "dist_threads = 8" to Manticore Search's config to even the chances
- one of the tests will be to fully utilize the server to measure max throughput. In this test if we see that the built-in multi-threading in either of the engines doesn't give max throughput we'll help it by adding multi-processing to multi-threading.
- Sufficient java heap size is important for Elasticsearch. The index takes only 23MB on disk, but we will let Elasticsearch use 32GB of RAM just in case
- For tests we will use this open source stress testing tool - https://github.com/Ivinco/stress-tester
- The both test plugins open a connection only once per child and fetch all found documents which is included into the latency
Running documents
Elasticsearch
So let's get started and first of all let's understand what max throughput Elasticsearch can give. We know that normally throughput grows when you increase the batch size, let's measure that with concurrency = 1 (-c=1) based on first 10000 documents (--limit=10000) out of those 600K downloaded from archive.org and used to populate the queries corpus.
$ for batchSize in 1 4 5 6 10 20 50 100 200; do ./test.php --plugin=es_pq_twitter.php --data=/home/snikolaev/twitter/text -b=$batchSize -c=1 --limit=10000 --csv; done;
concurrency;batch size;total time;throughput;elements count;latencies count;avg latency, ms;median latency, ms;95p latency, ms;99p latency, ms
1;1;34.638;288;10000;10000;3.27;2.702;6.457;23.308
1;4;21.413;466;10000;10000;8.381;6.135;19.207;57.288
1;5;20.184;495;10000;10000;9.926;7.285;22.768;60.953
1;6;19.773;505;10000;10000;11.634;8.672;26.118;63.064
1;10;19.984;500;10000;10000;19.687;15.826;57.909;76.686
1;20;23.438;426;10000;10000;46.662;40.104;101.406;119.874
1;50;30.882;323;10000;10000;153.864;157.726;232.276;251.269
1;100;69.842;143;10000;10000;696.237;390.192;2410.755;2684.982
1;200;146.443;68;10000;10000;2927.343;3221.381;3433.848;3661.143
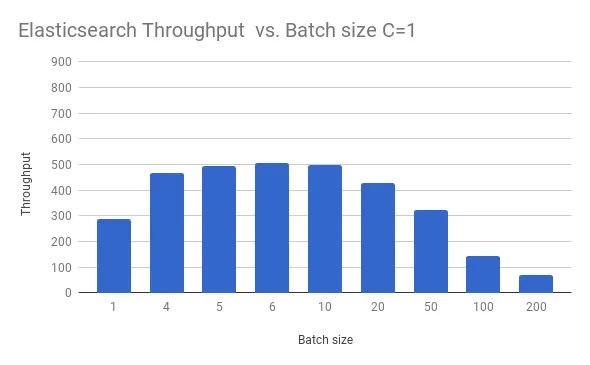 Indeed the throughput grows, but only until batch size 6-10, then it degrades. And the overall throughput looks very weak. On the other hand the latency looks very good, especially for the lowest batch size numbers - 3-20ms for batch sizes 1 - 10. At the same time I can see that the server is only 25% utilized which is good for the latency, but we also want to see max throughput, so let's re-run the test with concurrency = 8:
$ for batchSize in 1 4 5 6 10 20 50 100 200; do ./test.php --plugin=es_pq_twitter.php --data=/home/snikolaev/twitter/text -b=$batchSize -c=8 --limit=10000 --csv; done;
8;1;12.87;777;10000;10000;8.771;4.864;50.212;63.838
8;4;7.98;1253;10000;10000;24.071;12.5;77.675;103.735
8;5;7.133;1401;10000;10000;27.538;15.42;79.169;99.058
8;6;7.04;1420;10000;10000;32.978;19.097;87.458;111.311
8;10;7.374;1356;10000;10000;57.576;51.933;117.053;172.985
8;20;8.642;1157;10000;10000;136.103;125.133;228.399;288.927
8;50;11.565;864;10000;10000;454.78;448.788;659.542;781.465
8;100;25.57;391;10000;10000;1976.077;1110.372;6744.786;7822.412
8;200;52.251;191;10000;10000;7957.451;8980.085;9773.551;10167.927
1;200;146.443;68;10000;10000;2927.343;3221.381;3433.848;3661.143
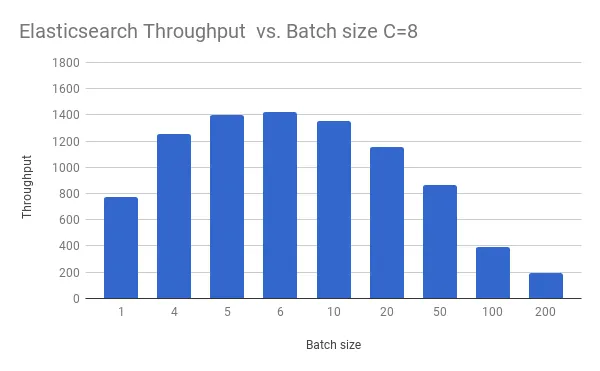 Much better: the server is fully loaded and the throughput is much higher now as well as latency. And we still see that Elaticsearch degrades after batch size 6-10:
Let's stick with batch size = 6, looks like it's the most optimal value for this test. Let's make a longer test and process 100K documents (--limit=100000):
$ ./test.php --plugin=es_pq_twitter.php --data=/home/snikolaev/twitter/text -b=6 -c=8 --limit=100000
Time elapsed: 0 sec, throughput (curr / from start): 0 / 0 rps, 0 children running, 100000 elements left
Time elapsed: 1.001 sec, throughput (curr / from start): 1510 / 1510 rps, 8 children running, 98440 elements left
Time elapsed: 2.002 sec, throughput (curr / from start): 1330 / 1420 rps, 8 children running, 97108 elements left
Time elapsed: 3.002 sec, throughput (curr / from start): 1433 / 1424 rps, 8 children running, 95674 elements left

...

Time elapsed: 67.099 sec, throughput (curr / from start): 1336 / 1465 rps, 8 children running, 1618 elements left
Time elapsed: 68.1 sec, throughput (curr / from start): 1431 / 1465 rps, 8 children running, 184 elements left

FINISHED. Total time: 68.345 sec, throughput: 1463 rps
Latency stats:
count: 100000 latencies analyzed
avg: 31.993 ms
median: 19.667 ms
95p: 83.06 ms
99p: 102.186 ms

Plugin's output:
Total matches: 509883
Count: 100000
And we have the number - Elasticsearch could process 1463 documents per second with avg latency ~32ms. The first 100K documents against 100K queries in the index have given 509883 matches. We need this number to then compare with Manticore Search to make sure they don't differ too much which means we do proper comparison.
Manticore Search
Let's now look at Manticore Search:
$ for batchSize in 1 4 5 6 10 20 50 100 200 300; do ./test.php --plugin=pq_twitter.php --data=/home/snikolaev/twitter/text -b=$batchSize -c=1 --limit=10000 --csv; done;
concurrency;batch size;total time;throughput;elements count;latencies count;avg latency, ms;median latency, ms;95p latency, ms;99p latency, ms
1;1;54.343;184;10000;10000;5.219;5.207;5.964;6.378
1;4;14.197;704;10000;10000;5.441;5.416;6.117;6.596
1;5;11.405;876;10000;10000;5.455;5.444;6.041;6.513
1;6;9.467;1056;10000;10000;5.466;5.436;6.116;6.534
1;10;5.935;1684;10000;10000;5.679;5.636;6.364;6.845
1;20;3.283;3045;10000;10000;6.149;6.042;7.097;8.001
1;50;1.605;6230;10000;10000;7.458;7.468;8.368;8.825
1;100;1.124;8899;10000;10000;10.019;9.972;11.654;12.542
1;200;0.95;10530;10000;10000;17.369;17.154;20.985;23.355
1;300;1.071;9334;10000;10000;29.058;28.667;34.449;42.163
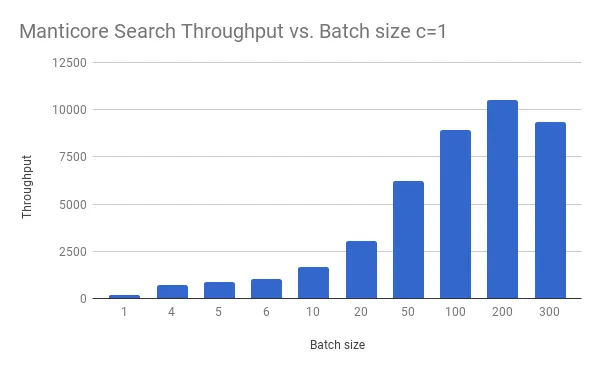 Manticore Search's throughput continues growing until batch size 200, at the same time the latency does not grow that much (from ms to seconds) as with Elasticsearch. It's 2ms higher than Elasticsearch's for batch size 1 though.
The throughput is even more different comparing to Elasticsearch. We can see that it's much lower for batch size < 20, but after that when Elasticsearch starts degrarding Manticore Searchs' throughput grows until 10K docs per second.
As well as with the initial Elastic's test we see that the server is not fully utilized (80% in this case comparing to Elastic's 25%). Let's increase the concurrency from 1 to 2 to load the server better:
$ for batchSize in 1 4 5 6 10 20 50 100 200 300; do ./test.php --plugin=pq_twitter.php --data=/home/snikolaev/twitter/text -b=$batchSize -c=2 --limit=10000 --csv; done;
concurrency;batch size;total time;throughput;elements count;latencies count;avg latency, ms;median latency, ms;95p latency, ms;99p latency, ms
2;1;44.715;223;10000;10000;8.445;8.017;12.682;15.386
2;4;11.852;843;10000;10000;8.906;8.493;13.411;16.085
2;5;9.468;1056;10000;10000;9.001;8.566;13.476;16.284
2;6;8.004;1249;10000;10000;9.073;8.626;13.647;15.848
2;10;4.931;2028;10000;10000;9.202;8.799;13.525;15.622
2;20;2.803;3567;10000;10000;9.924;9.352;15.322;18.252
2;50;1.352;7395;10000;10000;12.28;11.946;18.048;27.884
2;100;0.938;10659;10000;10000;17.098;16.832;22.914;26.719
2;200;0.76;13157;10000;10000;27.474;27.239;35.103;36.61
2;300;0.882;11337;10000;10000;47.747;47.611;63.327;70.952
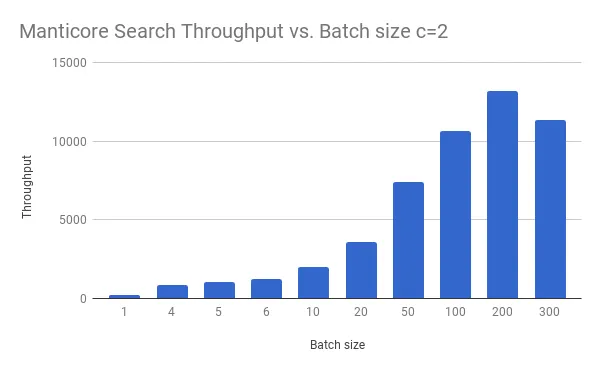 This increased the throughput for batch size 200 from 10K to 13157 docs per second, the latency increased too though.
Let's stick with this batch size and concurrency and run an extended test with 100K documents:
$ ./test.php --plugin=pq_twitter.php --data=/home/snikolaev/twitter/text -b=200 -c=2 --limit=100000
Time elapsed: 0 sec, throughput (curr / from start): 0 / 0 rps, 0 children running, 100000 elements left
Time elapsed: 1.001 sec, throughput (curr / from start): 12587 / 12586 rps, 2 children running, 87000 elements left
Time elapsed: 2.002 sec, throughput (curr / from start): 12990 / 12787 rps, 2 children running, 73800 elements left
Time elapsed: 3.002 sec, throughput (curr / from start): 13397 / 12991 rps, 2 children running, 60600 elements left
Time elapsed: 4.003 sec, throughput (curr / from start): 12992 / 12991 rps, 2 children running, 47600 elements left
Time elapsed: 5.004 sec, throughput (curr / from start): 12984 / 12989 rps, 2 children running, 34600 elements left
Time elapsed: 6.005 sec, throughput (curr / from start): 12787 / 12956 rps, 2 children running, 21800 elements left
Time elapsed: 7.005 sec, throughput (curr / from start): 12999 / 12962 rps, 2 children running, 8800 elements left

FINISHED. Total time: 7.722 sec, throughput: 12949 rps
Latency stats:
count: 100000 latencies analyzed
avg: 28.631 ms
median: 28.111 ms
95p: 37.679 ms
99p: 44.615 ms

Plugin's output:
Total matches: 518874
Count: 100000
We can see that:
- Total matches doesn't differ much (519K vs 510K in Elastic) which means we compare things properly, the slight difference is probably caused by minor difference in text tokenization
- The throughput is 12949 documents per second
- The average latency is ~29ms
The following 2 charts show comparison between Elasticsearch and Manticore Search at max throughput.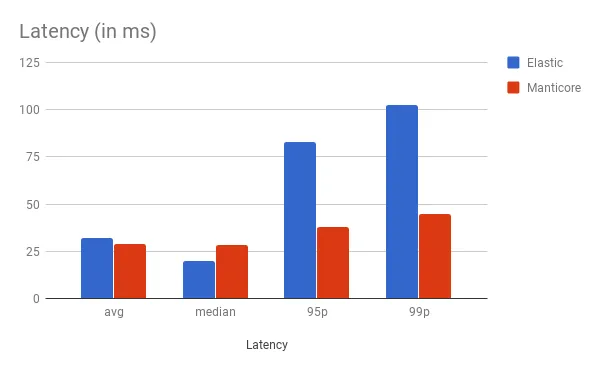
Median (50th percentile) latency is few milliseconds better in Elasticsearch, avg is a little bit better in Manticore Search. 95p and 99p latency differ a lot: Elasticsearch wins here.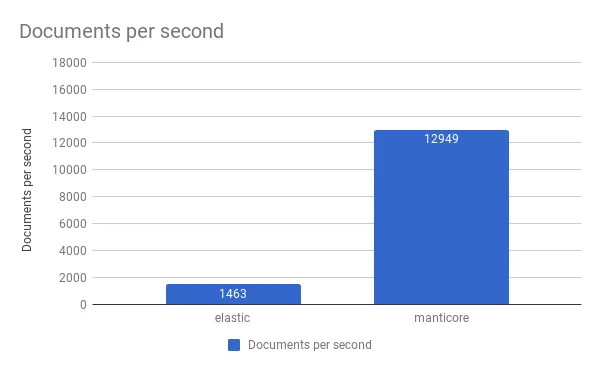
But when it comes to the throughput Manticore Search outperforms Elasticsearch by more than 8 times.
Conclusions
- If you need to process thousands of documents per second and can afford tens of milliseconds latency (namely 32ms) Manticore Search can provide much higher throughput: ~13K rps vs 1463 rps with Elastic
- If your goal is extremely low and stable latency (few ms) and you don't have lots of documents or can afford distributing your load among many servers (e.g. 8 Elasticsearch servers instead of 1 running Manticore Search) to provide the desired latency Elasticsearch can provide as low as 3.27ms latency at throughput of 288 docs per second. Manticore Search can only give 5.2ms at 188 rps or 29ms at 13K rps.