

Manticore Search 32.1.3 makes large data loads faster, improves full-text and vector queries, and includes a long list of correctness and reliability fixes. The main new feature is direct-to-disk bulk import for local, sharded, and replicated real-time tables.
This post covers what changed after 29.9.0 , from 29.9.1 through 32.1.3.
❤️ Thanks to @tudorvasinca (#4858 , #4924 , #4925 ), @vitlav (#5060 ), @RaphaelFakhri (#5031 ), and @drahy333 (Columnar #217 ) for their contributions.
Upgrade notes
If you don't use replication, no special migration is needed. Back up your data and upgrade normally.
If you use a replication cluster, do not perform a rolling upgrade: old and new Manticore Search versions cannot run in the same cluster. Stop writes, confirm that the nodes are synced, and shut down each node cleanly, one at a time. Remember which node stopped last. Upgrade every node while they are stopped, then start the last stopped node first with manticore_new_cluster (systemd) or searchd --new-cluster. Start the other nodes normally and wait for synchronization before resuming writes. For an unexpected full-cluster shutdown, follow the cluster recovery guide
instead.
One other change is unlikely to affect most installations: Manticore now refuses to start if an existing manticore.json file is empty. This automatically maintained file lists tables and clusters in real-time mode. The change prevents a damaged file from silently making every table appear missing. If startup works normally, you have nothing to check. See the breaking changes
for details.
Direct-to-disk bulk import
With regular INSERT or /bulk, documents become searchable immediately after COMMIT. That is useful for continuous ingestion, but when loading a large archive of logs, finishing the import quickly often matters more than searching documents before the load completes. Bulk import
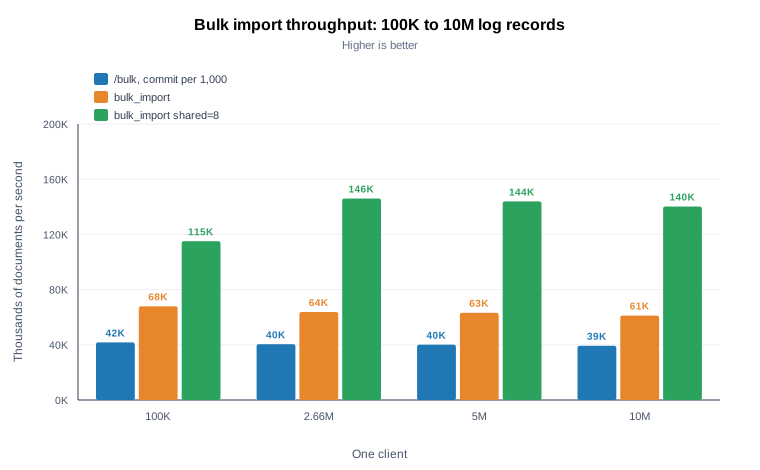
addresses this trade-off: Manticore passes data to indexer, which builds disk chunks that are added to the table at COMMIT, without making incoming documents searchable during the load. This can make ingestion faster without buffering the whole batch in a RAM chunk. On a 6-core, 12-thread server with 16 GB RAM, importing 10 million nginx log records took 254 seconds with regular /bulk, about 164 seconds with bulk_import, and 71 seconds with shared=8. The chart below shows throughput at different dataset sizes. For a local real-time table, the SQL workflow looks like this:
SET bulk_import=products;
INSERT INTO products(id, title, price) VALUES
  (101, 'Notebook', 12.50),
  (102, 'Desk lamp', 24.00);
COMMIT;
SET bulk_import=0;
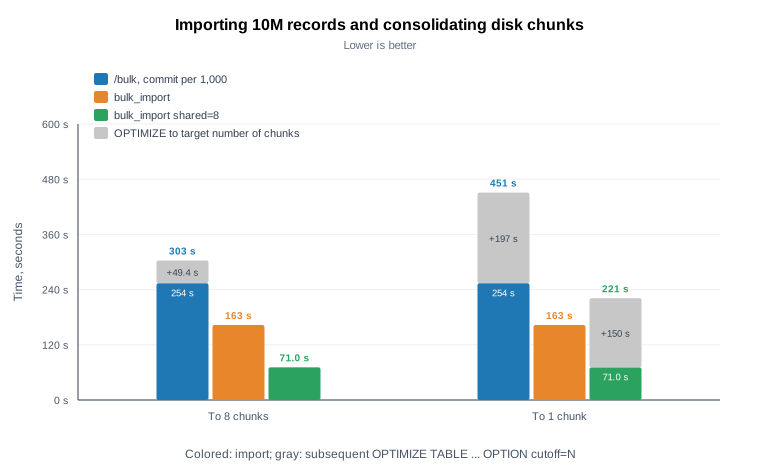
bulk_import also works through the HTTP /bulk endpoint. With shared, concurrent clients feed a shared pool of indexer processes, and automatically generated document IDs are supported. Another benefit is less work after ingestion: in the same test, regular /bulk left 17 disk chunks plus a RAM chunk, and consolidating them into one chunk required about 197 additional seconds of OPTIMIZE. A single-commit bulk_import produced one disk chunk immediately, while shared=8 produced eight. The chart above includes that additional optimization time. The new bulk_import mode supports not only local real-time tables but also sharded
and replicated tables
. The coordinating node routes documents to shards, and built disk chunks are distributed to replicas, without first importing into a separate local table.
Bulk import deliberately reserves the affected table for writes during an active load; searches can continue. Check the documentation for commit, cleanup, and failure behavior before using it in production.
Faster full-text and vector search
The full-text optimizations tracked in issue #5110 reduce work in several query paths without requiring a new index format:
- Eligible single-term
COUNT(*)queries can use dictionary counts, while more complex count queries can skip ranking. - Eligible
OR/ANDcounts and unranked queries process 4,096-row bitmap windows, with adaptive matching and CPU-specific SIMD acceleration. - Faster posting-list decoding and prefetching reduce read overhead. Filters that match an entire chunk can be skipped, and
GROUP BYcan prefetch blob data. access_doclistsandaccess_hitlistsnow default tommap. Set them tofileto retain buffered reads.
Vector search also receives better rescoring prefetch, including row-wise storage; more efficient parallel HNSW construction during FLUSH RAMCHUNK; and improvements to filtered KNN queries. These changes affect different workloads, so a single speedup figure would be misleading.
Performance benchmark results
We compared versions 29.9.0 and 32.1.2 in db-benchmarks , using a 110 GB memory limit and both row-wise and columnar storage. The three datasets cover different workloads: Hacker News has over 100 million comments for full-text and analytical queries; Logs10m has 10 million nginx access-log records for typical log-analysis queries; Taxi has 1.7 billion New York City taxi and for-hire vehicle trips, used mostly for analytical queries. The numbers below are fast-average query latencies (lower is better).
The five screenshots show individual query results, not an across-the-board speedup. We highlight improvements only where the benchmark marks the difference in red; pale-pink differences may be measurement noise. This does not mean every query or dataset has become faster.
Hacker News: up to 1.86x faster for the highlighted queries
In the tuned columnar run, match('abc -google') went from 13 ms to 7 ms (1.86x). A filtered grouping query went from 15 ms to 11 ms (1.36x). In tuned row-wise storage, the same negated full-text query went from 12 ms to 7 ms (1.71x), while grouping by story author and sorting by count went from 576 ms to 482 ms (1.20x).
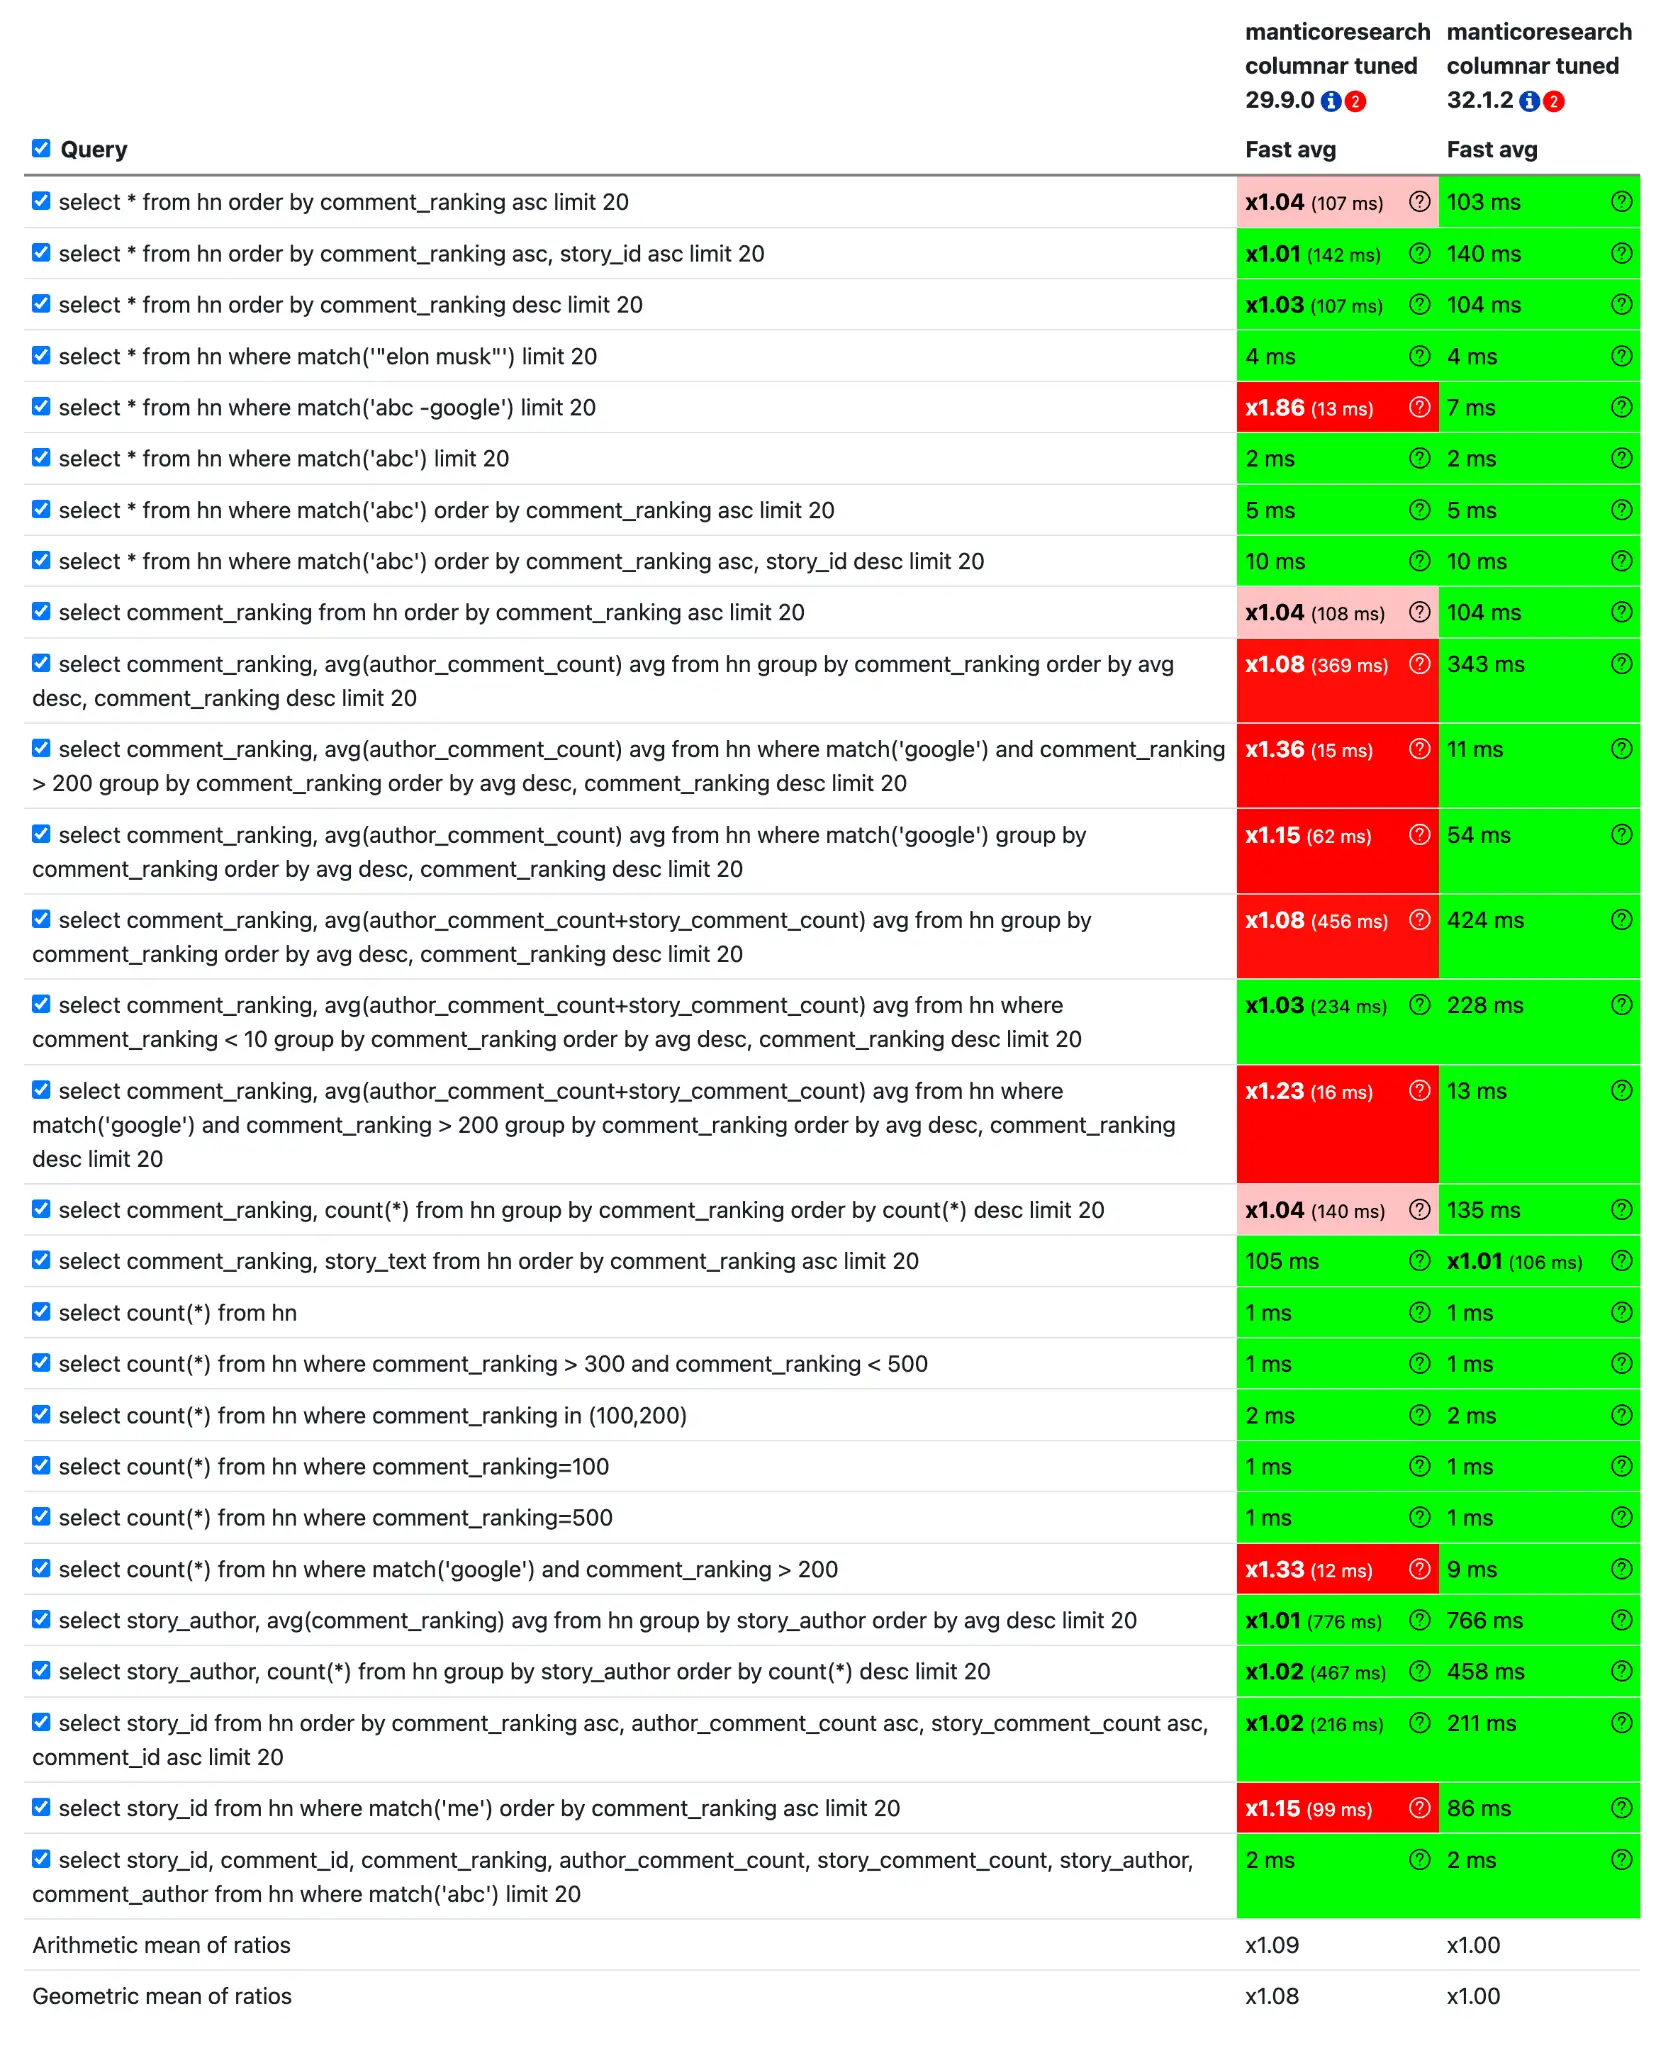
Tuned columnar HN benchmark — query latencies for 29.9.0 and 32.1.2 (110 GB configuration).
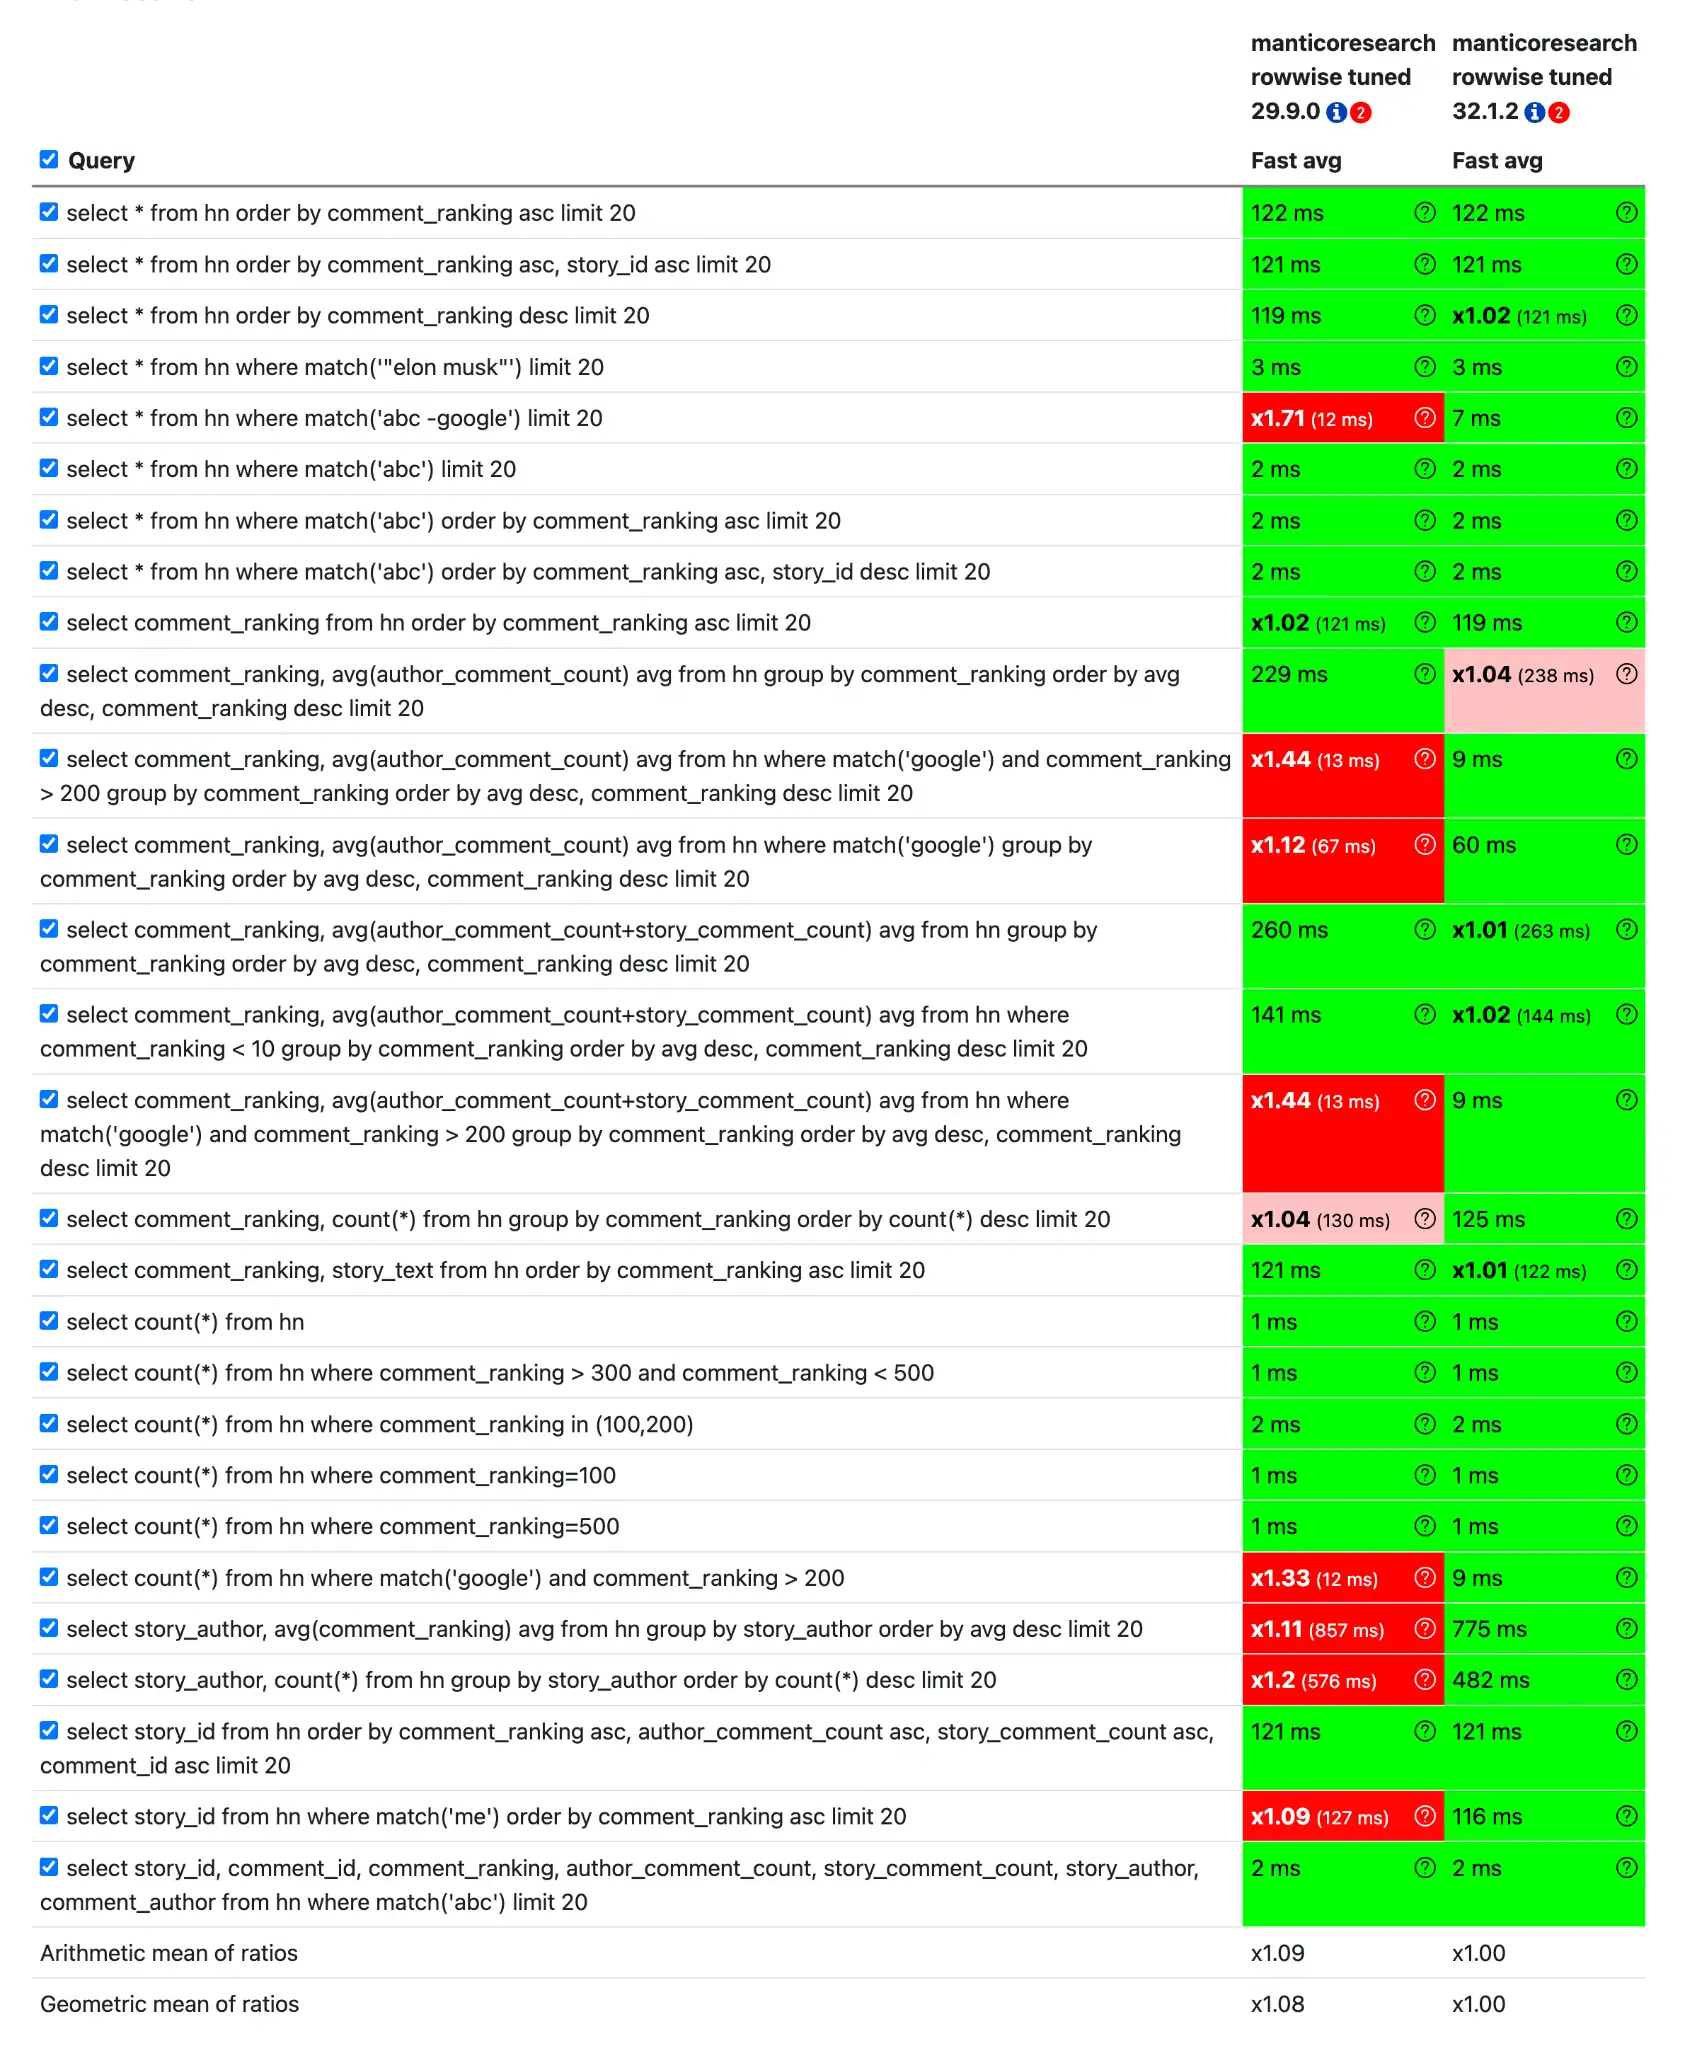
Tuned row-wise HN benchmark — query latencies for 29.9.0 and 32.1.2 (110 GB configuration).
Many simple HN queries remain at 1–3 ms in both versions. Small differences outside the red-highlighted results are not enough to establish a performance change.
Logs10m: the largest gains are in row-wise grouping
For row-wise log data, grouping by request_path and sorting by count dropped from 221 ms to 121 ms (1.83x). Sorting similar groups by average runtime dropped from 238 ms to 137 ms (1.74x).
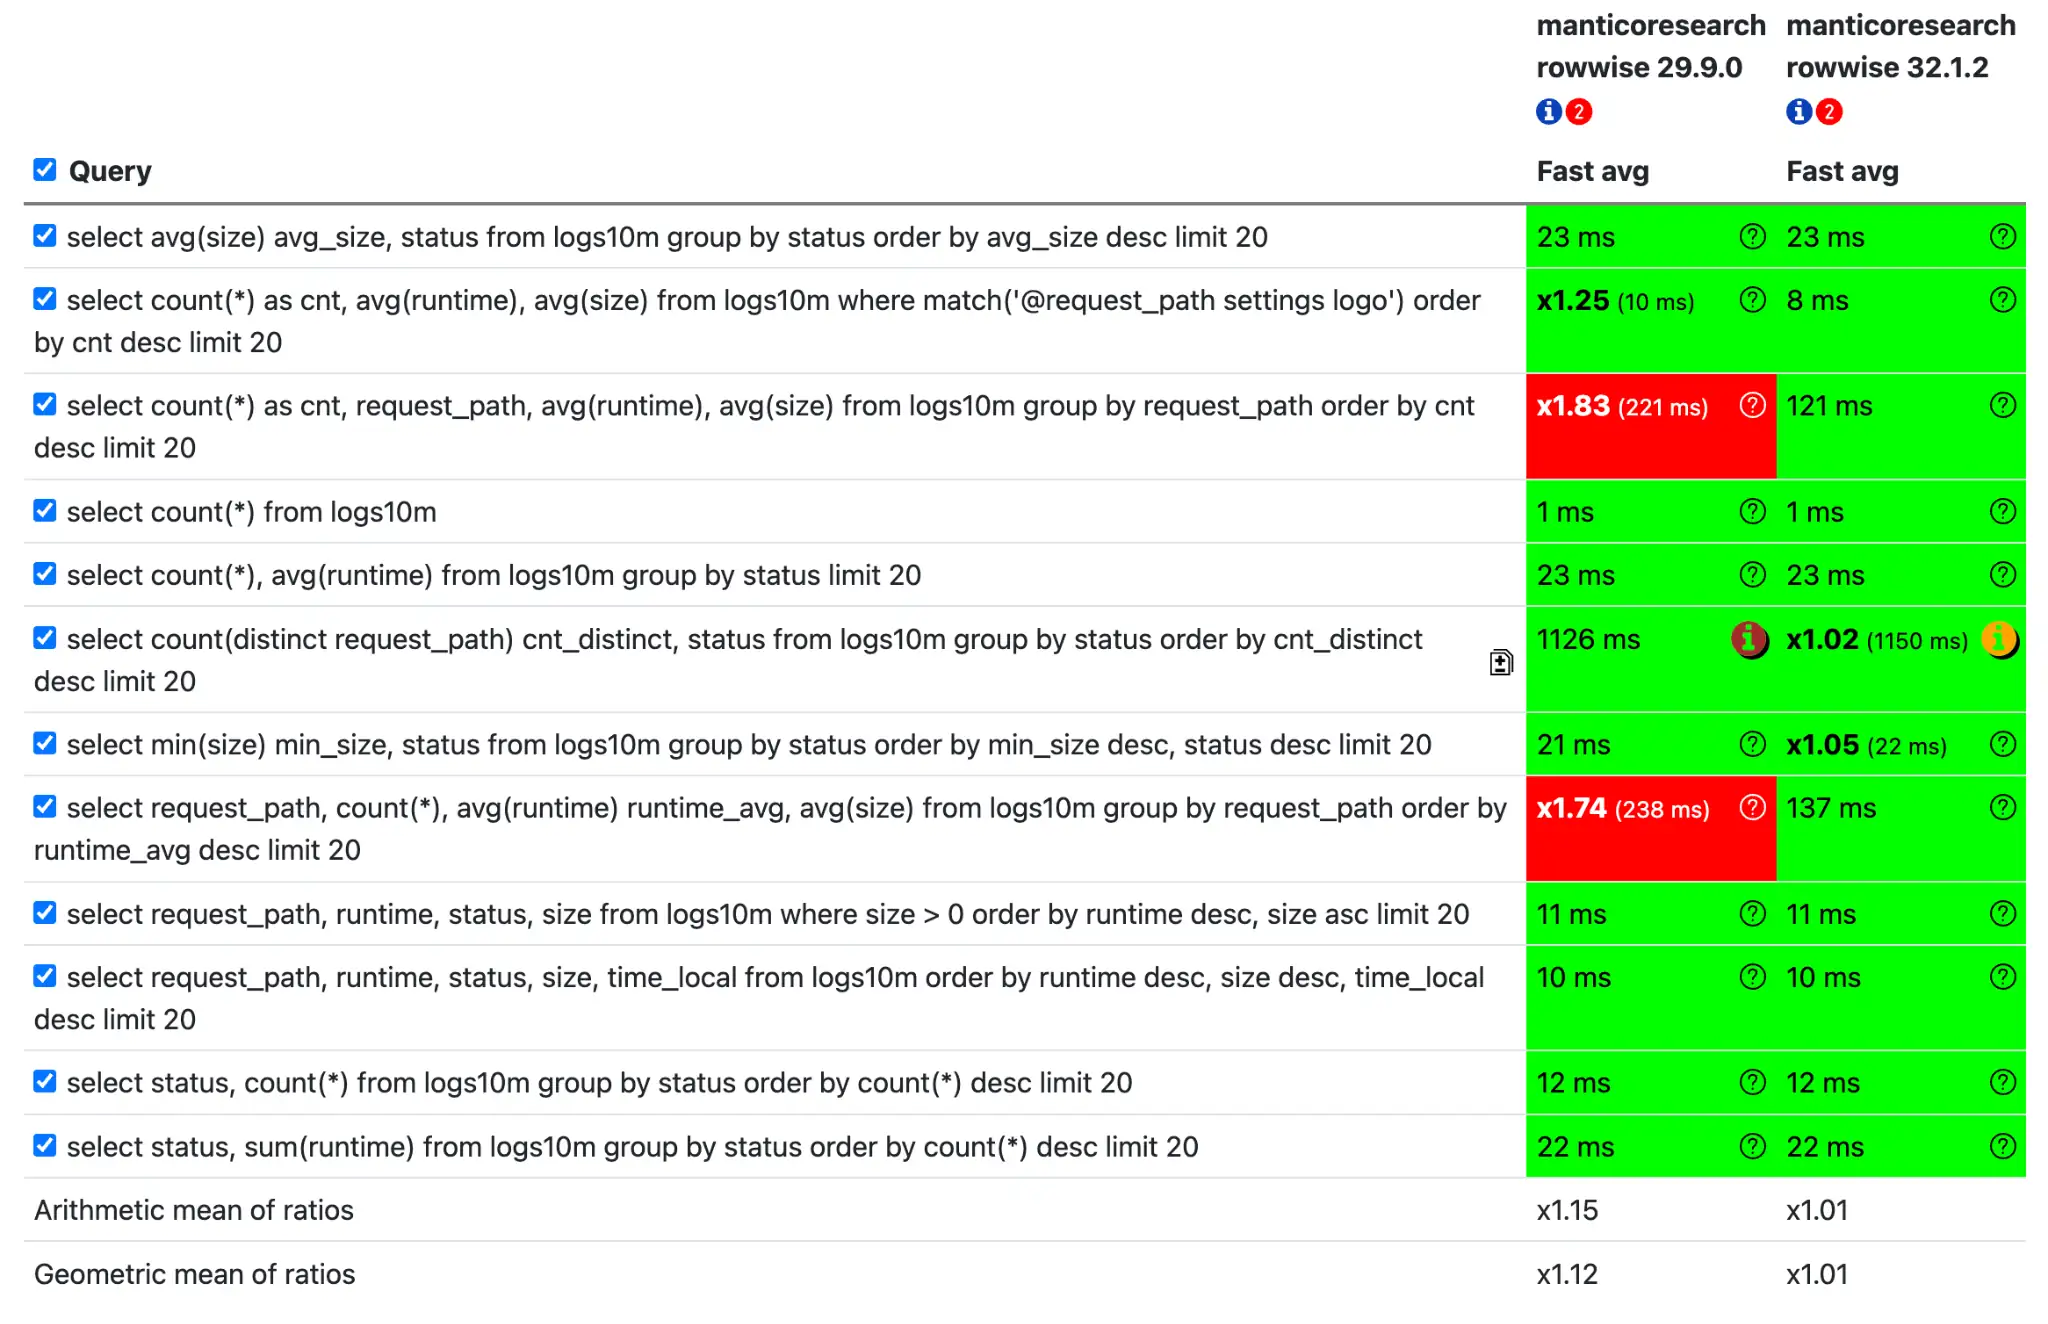
Row-wise Logs10m benchmark — query latencies for 29.9.0 and 32.1.2 (110 GB configuration).
With columnar storage, a GROUP BY status aggregation went from 27 ms to 24 ms (1.13x). Most other results are close enough that we would not draw conclusions from them.
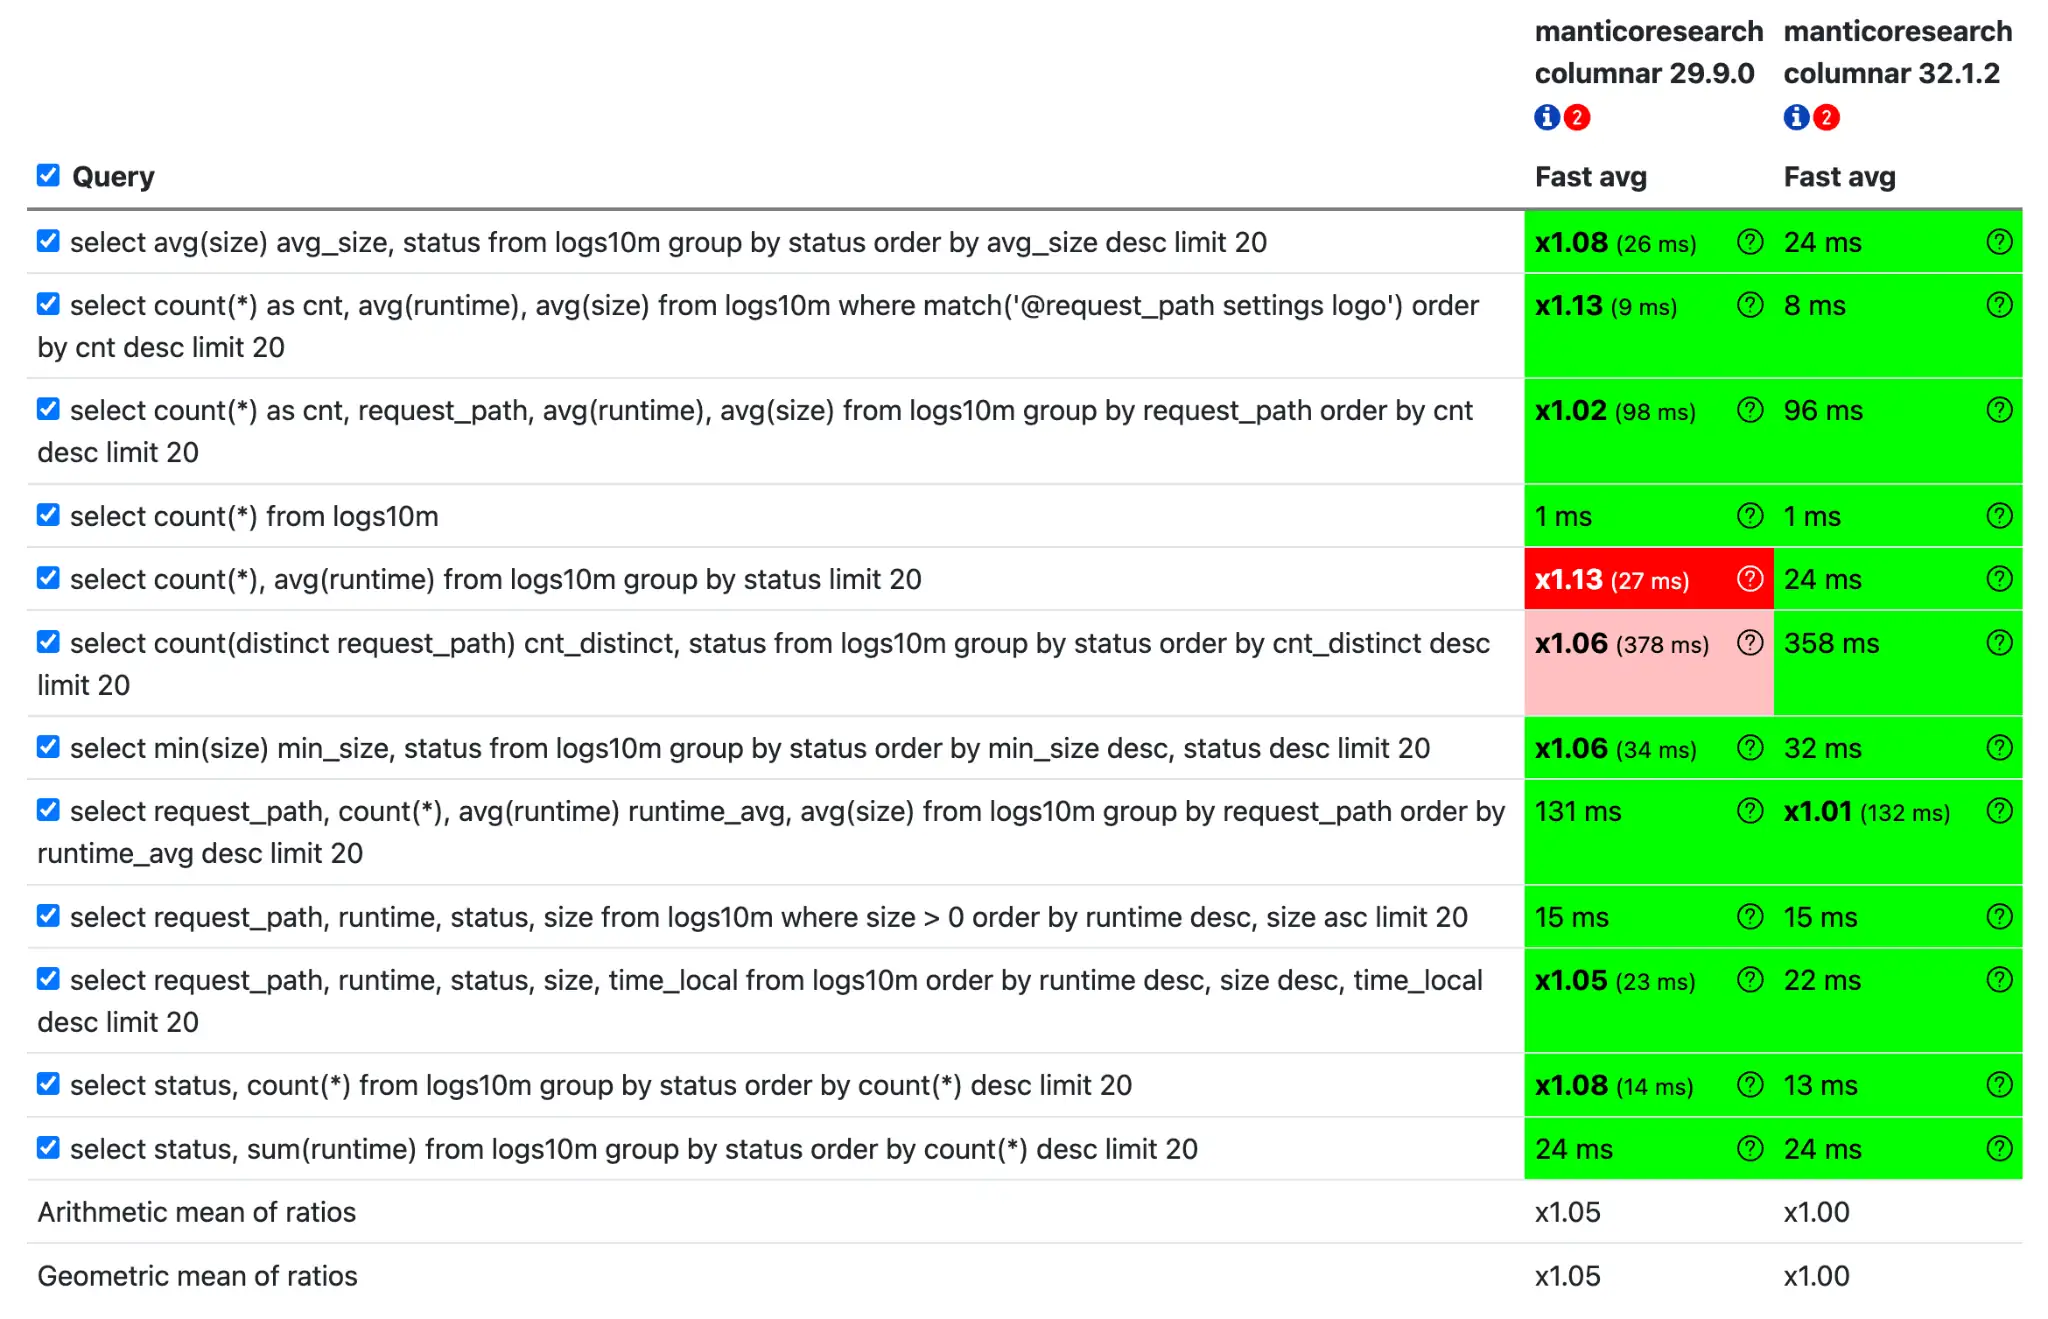
Columnar Logs10m benchmark — query latencies for 29.9.0 and 32.1.2 (110 GB configuration).
Taxi: faster full-text matching and aggregation
On tuned columnar storage, MATCH('harlem east') improved from 255 ms to 172 ms (1.48x), and AVG(total_amount) over the table improved from 2,591 ms to 2,136 ms (1.21x). Several grouped aggregations also have red-highlighted improvements.
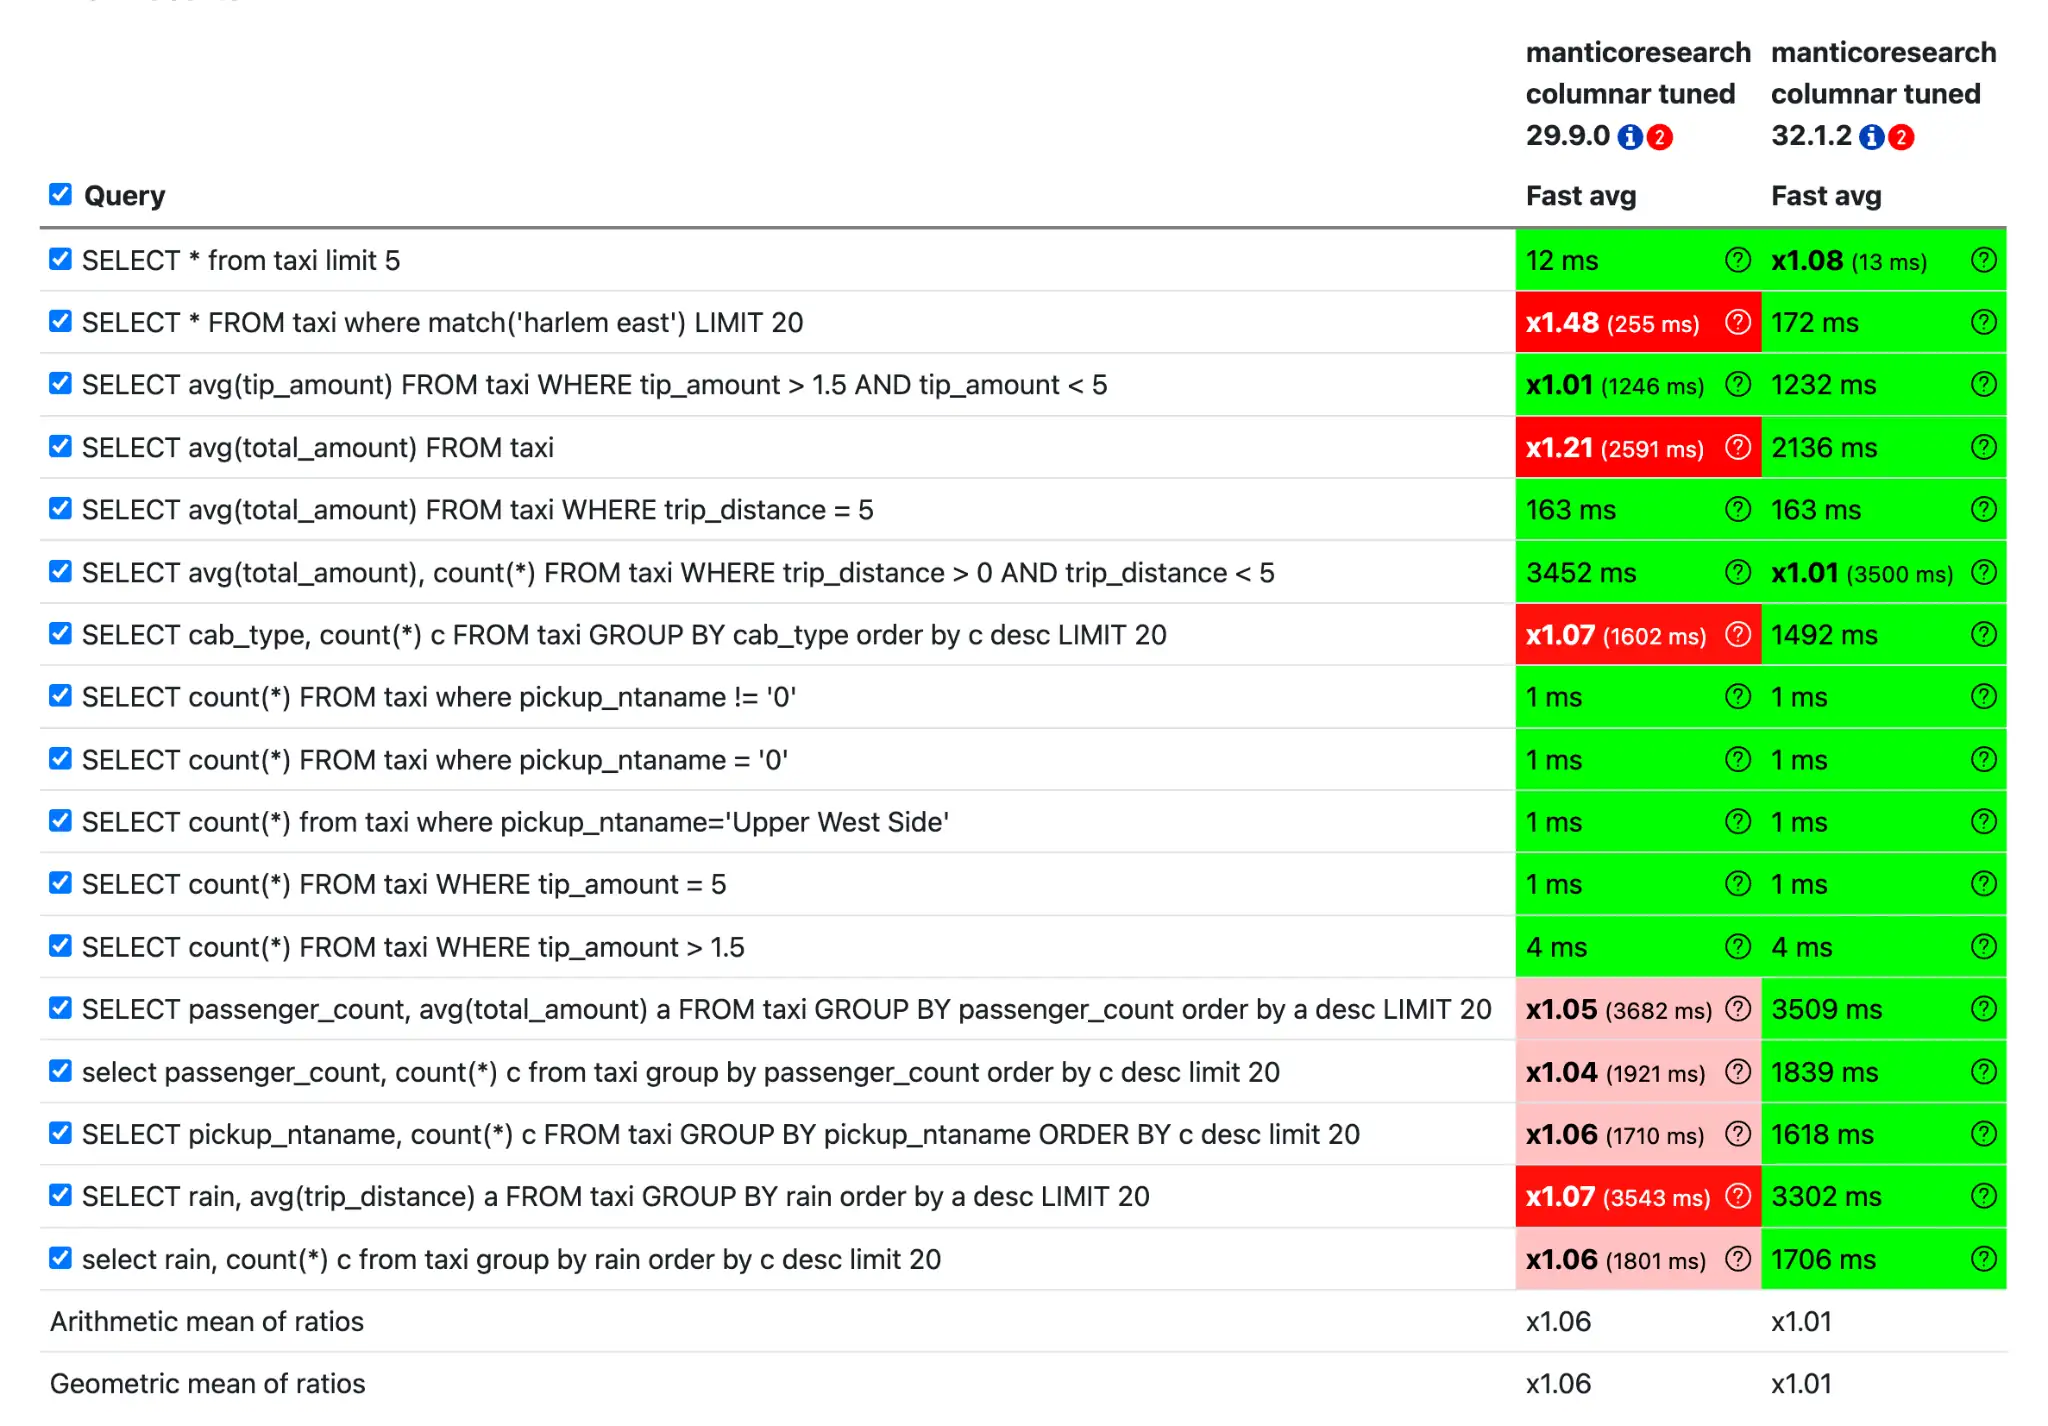
Tuned columnar Taxi benchmark — query latencies for 29.9.0 and 32.1.2 (110 GB configuration).
Takeaway: The benchmark shows clear improvements for selected full-text and grouping queries, especially on HN and row-wise Logs10m. Small unhighlighted or pale-pink differences do not establish a speedup or regression. Your own results will depend on query shape, memory limits, and storage layout.
Hybrid search, embeddings, and more accurate results
Hybrid search
now supports facets on the fused set of full-text and KNN candidates. SQL FACET and JSON aggregations can count matching categories across the hybrid results, not just the few rows returned by LIMIT.
Auto-chunked embeddings can highlight the specific text chunk that matched a vector query, making it easier to understand why a long document appeared in the results.
There is also a substantial set of correctness fixes. JSON and multi-value filters now behave more consistently across secondary indexes, columnar and row-wise storage, SQL, and HTTP. Fixes cover ANY(), ALL(), range and exclusion filters, and COUNT(DISTINCT). If you have JSON secondary indexes built before these fixes, some affected indexes may need ALTER TABLE ... REBUILD SECONDARY
to correct their stored values.
Reliability improvements
Several fixes are especially relevant to production deployments:
- Executor 1.4.9 brings PHP 8.5.13 security fixes. (PR #5121 )
- Safer saves of the table and cluster registry (
manticore.json) after a power loss. - More reliable replication joins, state transfers, and cluster bootstrap after a full shutdown.
- Fixes for percolate-query writes and metadata races during concurrent flushes.
- Corrected cached query results under pseudo-sharding and fixes for selected columnar and hybrid-search crashes.
- Better diagnostics for crashes during background work and fixes for
FREEZE,index_converter, and some MySQL-protocol edge cases.
For the full list of changes, see the 32.1.3 changelog .
Get Manticore Search 32.1.3
Install or upgrade using the installation guide . If you use replication, follow the upgrade notes above before restarting your cluster.
Need help or want to connect?
- Join our Slack
- Visit the Forum
- Report bugs and suggest features on GitHub
- Email us at
[email protected]